How do cells regulate energy metabolism during migration?
|
This may come as a surprise, but many cells in our body are dynamic and motile, even if their function is seemingly static. A great example of this are epithelial cell layers that act as barriers which protect our organs from exposure to harmful materials. Think of our skin which is composed of layers of specialized epithelial cells and protect our body from outside insults. It turns out we have many epithelial cell layers throughout our body protecting our lungs, kidneys, and even our intestines!
These tissues move like a flowing liquid through a process called epithelial cell layer unjamming! The video here shows a monolayer of MDCKII cells (kidney epithelial cells derived from a dog) migrating into free space and flowing as if it were a fluid. We call this layer unjammed. |
|
|
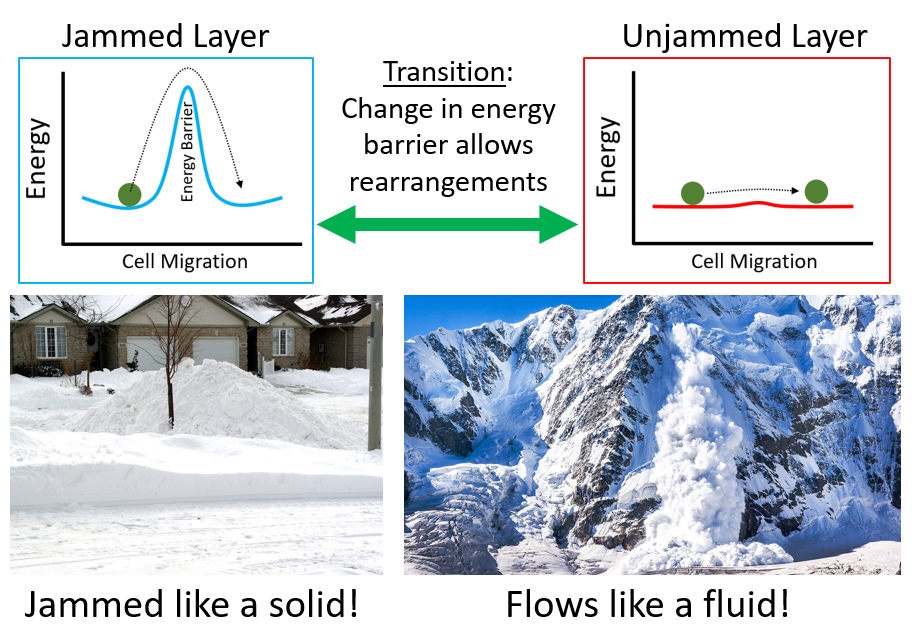
Unjamming occurs in nature!Unjamming is a process where a material transitions from a non-motile 'stuck' state to a flowing 'un-stuck' state. The energy barrier for the material to rearrange determines whether it is jammed or unjammed. When the energy barrier is high, this prevents the material from rearranging and flowing. Instead, it remains 'stuck' or 'trapped' in the configuration. Conversely, if the energy barrier is low, the material can rearrange resulting in an 'unstuck' flowing material. We see this occur in nature where snow piles remain jammed and behave like a solid. But snow can also unjam and flow like a fluid during an avalanche.
|
How do cells power this type of cell migration?
|
This question has been the main focus on my postdoc in the Fredberg lab at the Harvard School of Public Health. I am interested in learning how tissue mechanics (cells exerting forces on the substrate), cell migration dynamics (speed), and cell morphology (shape) are related to energy metabolism in the cell. As such, this requires a novel integration strategy that leverages methods from physics, biology, and computer science. Here, I simultaneously measure these biophysical quantities with temporal and spatial resolution resulting in one of the largest such datasets that includes biophysical, mechanical, and metabolic information in the expanding epithelial cell layer.
|
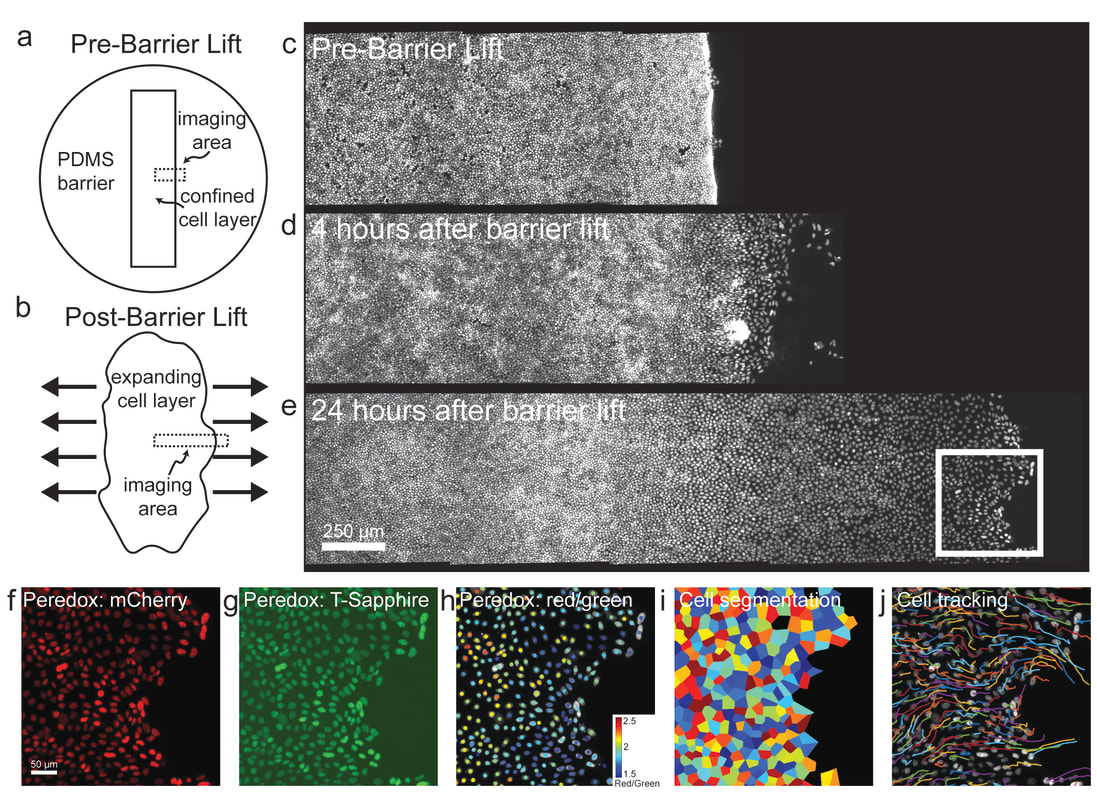
This experiment integrates numerous fields (physics, biology, and computer science) to answer questions related to biomechanics and energy metabolism.
|
Energy metabolism during migration
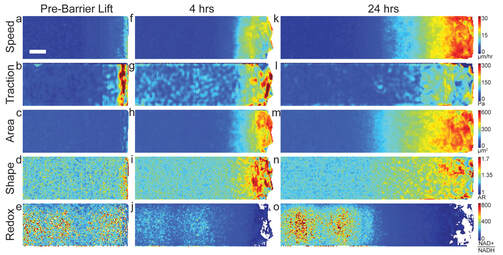
My primary finding is that epithelial cells shift their energy metabolism toward more glycolytic activity after unjamming and becoming migratory. Interestingly, the shift occurs not only at the leading edge where cells are beginning to migrate, but also deep in the cell layer where the cells are still jammed.
|
This figure shows spatial maps at three different timepoints (Pre-Barrier lift, 4 hours after lifting the barrier, and 24 hours after lifting the barrier). Each row depicts a biophysical quantity that I have measured simultaneously across the entire cell layer. This data shows that the cytoplasmic redox ratio (NAD/NADH) decreases at the leading edge while cell shapes, area, traction forces, and migration speed increase. The redox ratio was measured using a transfectable biosensor called Peredox and it reports on the cytoplasmic NAD/NADH ratio. The decrease in the redox ratio that we see here is indicative of a shift toward glycolytic metabolism.
|
|
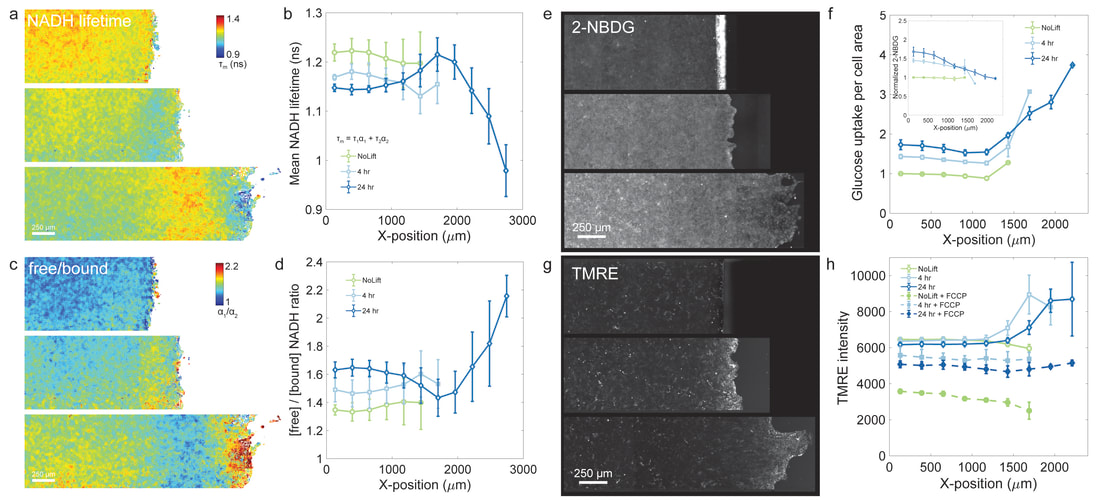
In addition to the Peredox biosensor, we also employ fluorescence lifetime imaging microscopy (FLIM), glucose uptake assay (2-NBDG), and the mitochondrial membrane potential assay (TMRE). These measurements, taken together, confirms that a general shift toward glycolytic activity occurs in the unjamming cell layer.
|
|
References for this work:
Epithelial layer unjamming shifts energy metabolism toward glycolysis
Stephen J. DeCamp*, Victor M.K. Tsuda*, Jacopo Ferruzzi*, Stephan A. Koehler, John T. Giblin, Darren Roblyer, Muhammad H. Zaman, Scott T. Weiss, Ayşe Kılıç, Margherita De Marzio, Chan Young Park, Nicolas Chiu Ogassavara, Jennifer Mitchel, James P. Butler, Jeffrey J. Fredberg.
Scientific Reports (Accepted for publication, In Press)
In primary airway epithelial cells, the unjamming transition is distinct from the epithelial-to-mesenchymal transition
Jennifer A. Mitchel*, Amit Das*, Michael J. O’Sullivan, Ian T. Stancil, Stephen J. DeCamp, Stephan Koehler, Oscar H. Ocaña, James P. Butler, Jeffrey J. Fredberg, M. Angela Nieto, Dapeng Bi, Jin-Ah Park.
Nature Communications, 11:5053, 2020.
Geometrical constraints during epithelial jamming
Lior Atia, Dapeng Bi, Yasha Sharma, Jennifer A. Mitchel, Bomi Gweon, Stephan Koehler, Stephen J. DeCamp, Bo Lan, Jae Hun Kim, Rebecca Hirsch, Adrian F. Pegoraro, Kyu Ha Lee, Jacqueline Starr, David A. Weitz, Adam C. Martin, Jin-Ah Park, James P. Butler, Jeffrey J. Fredberg.
Nature Physics, 14:613-20, 2018.
Scaling physiologic function from cell to tissue in asthma, cancer, and development
Yasha Sharma, Lior Atia, Chrystalyn Sims Rhodes, Stephen J. DeCamp, Jennifer Mitchel, Jeffery J. Fredberg.
Annals of the American Thoracic Society, 1 Feb 2018; 15(1).